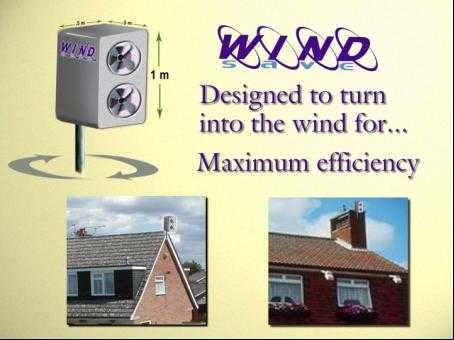
The image below is from Windsave website about 3-4 years ago - this
was their product!
These are the same people who now supply B&Q with their very
popular turbine. It has matured a bit over the few years of
experimentation but there is little evidence that the makers have
learned much about siting small wind turbines.
These guys came out of nowhere a few years back claiming they had all
the answers but their web pages do not make any sense.
One does not know whether to laugh or cry.
Marketing is their strong card but they cannot deliver, because
the wind is not there.
They are offering a product that everyone wants, but sadly it is not
technically possible to supply.
COPY OF AN EMAIL TO THE BWEA (British Wind Energy Association) 05
January 2007
CEO, British wind Energy Association
Dear Maria McCaffery,
I am writing to you because I am very concerned about the claims made
by Windsave and other rooftop wind turbine manufacturers and their
agents. I suggest that BWEA would do well to distance itself from
these people before the resulting fiasco reflects on the windpower
industry as a whole.
For example, last night on TV I saw the boss of B&Q confidently
assert that a Windsave turbine would save a typical householder 25-40%
of their electricity bill. I was very pleased when the
interviewer did ask if there was enough wind. This is a big worry
for me. I know there is not enough wind in most city locations to
make this possible. He replied that maybe 20% of sites would not
be suitable. I don't think he has a clue what he is getting into.
There does not appear to have been any systematic assessment of the
wind resource at rooftop level in an urban environment. This
seems ludicrous given that Windsave attracts a 30% grant from
LCBP. My own tests over one year in Edinburgh revealed a huge
shortfall of wind compared to the annual mean that might be expected
based on NOABL. The Windsave web site (which is full of glaring
errors) states that "According to the
Department
of Trade and Industry (DTI), the average wind speed across
the UK is approximately 5.6 metres per second [m/s] at 10m above ground
level (agl)." This nonsense is widely believed. Of course
it is not true because of localised obstacles, especially in built-up
areas where the turbines will be sold.
My experience is that the general public have highly inflated
expectations of small wind turbines. I have been in the business
for nearly 30 years and I am constantly dealing with people who wildly
overestimate the amount of energy they will get from small wind
turbines. I spend much of my time educating them and explaining
that windpower will not do what they expect. There is a massive
opportunity for marketing here, but only for the unscrupulous (or
ignorant). I am very surprised that BWEA are willing to even
recognise organisations such as Windsave and Renewable Devices that
make wild claims for their rooftop products. This can only end in
tears. There are very few sites where the expected energy can be
produced. Siting a wind turbine below the ridge of a building (at
bedroom window level) in the back garden of an urban dwelling as shown
in the product literature is absolutely crazy!
I strongly suggest that BWEA make some sort of public statement warning
of the dangers of this latest marketing racket. Otherwise wind energy
as a whole will take a massive hit to its credibility. I suggest
that you demand evidence from Windsave and Renewable Devices to support
their improbably energy production claims. I suggest that you
contact the BRE and the EST and get them to do their homework before
they offer grants for these installations.
What I find is that when people learn that small wind turbines cannot
deliver on their assumptions, they go on to assume the wind energy as a
whole is a waste of time, or worse a complete scam. We need to
educate the public to understand what wind energy can do and what it
cannot. My experience is that when people learn how little energy
is available at rooftop level, they immediately extrapolate this lesson
to windfarm level, and decide that wind energy is completely irrelevant
(see for example
http://www.timhunkin.com/a125_arch-windpower.htm).
I really hope that you will take this request seriously. If
nothing else, please try to find out more about the wind at rooftop
level in the UK. I think you will find that there is not enough
to do anything useful. This is a matter of some urgency now, and
soon it will be too late to avoid a complete disaster for the industry.
All the best, and let's hope for a windy new year :-)
--
Hugh Piggott
Scoraig Wind Electric
Wind turbines should be installed on suitable
towers
Here is a photo of a suitable tower for small wind turbines in a built
up setting

(thanks to
Bergey Windpower)
"A wind generator tower is very
often more expensive than the turbine.
The tower puts the turbine up in the “fuel”— the smooth strong winds
that give the most energy. Wind turbines should be sited at least
30
feet (9 m) higher than anything within 500 feet (152 m)."
Ian
Woofenden -
Home Power magazine
Since 1987, we've dedicated
more
than 100 issues to home-scale renewable energy and sustainable living
solutions. That means comprehensive coverage of solar, wind, and
microhydro electricity, home energy efficiency, solar hot water
systems, space heating and cooling, green building materials and home
design, efficient transportation, and much, much more.
Whether you're a do-it-yourselfer or
not, off-grid or on-grid, Home Power is here to help you make informed
decisions about your home energy use. We provide extensive product
information, homeowner testimonials, buyer advice, and "how-to"
instructions.
 Logie
Green Road, Canonmills


 (thanks to